As a small- to-medium size business owner, your time is valuable and you are often busy wearing many hats to help your business succeed. You’re busy trying to focus on creating new products, while managing the company finances, and making sure your products are shipped in a timely fashion and at the best price possible. When you’re not busy focusing on the above listed essentials, you’re putting your efforts into increasing sales. This could be from a variety of avenues including organic sales via SEO, paid advertising on Google or Bing, shopping feeds, and one of my personal favorites: social media marketing.
It can be a bit overwhelming to review social media marketing metrics and deciphering what is important and what is not. While Facebook likes and Instagram followers are nice, large followings are easy to obtain via slimy tactics such as buying fake followers. If there is one thing that I suggest to merchants that are new to social media and are trying to make the most of their efforts, it's never buy followers. I’m always weary of Instagram accounts with 45k followers and only a handful of posts. Unless your brand has recently been on Shark Tank or you have a famous spokesman, instant success with numbers like these is highly unlikely.
So which social media reporting metrics should you focus on? Let’s cover 6 that are key to measuring your success with Facebook and Instagram advertising.
Google Analytics Social Media Metrics for Ecommerce
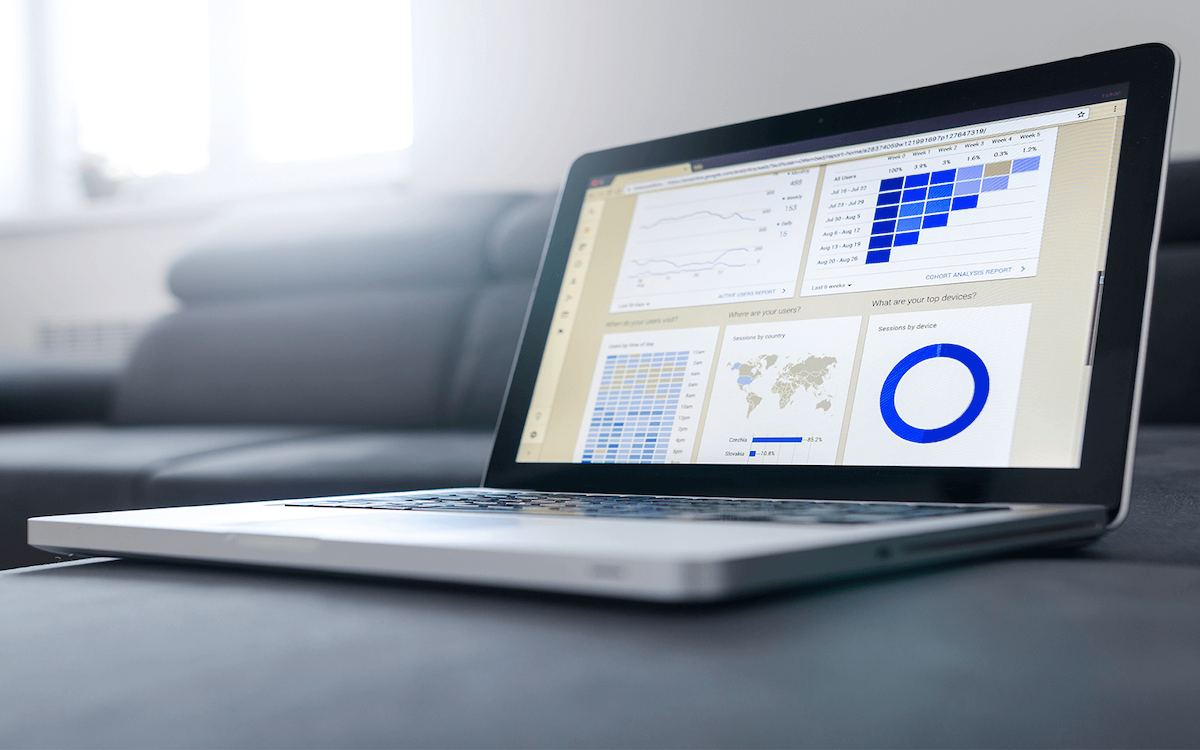
Network Referrals are an essential social media metric for an ecommerce company in Google Analytics is Network Referrals. This will show you which social networks are sending the most traffic to your website and where you should be focusing your efforts. While it’s important to have a presence on the big social networks (Facebook, Instagram, Pinterest, and Twitter) it is not mandatory to post on all of these networks regularly. We recommend picking 2-3 networks that your audience is most active and engaging on and sticking to those.
Network referrals can be helpful in finding new networks to be active on. For instance, if Reddit is sending a large amount of referral traffic to your site, you should investigate why this is happening and see if there is a way to capitalize from it. Reddit is becoming a marketer’s diamond in the rough, as the network is often overlooked by brands, but when done correctly, it can provide a boost to your bottom line as well as traffic to your site.
Google Analytics will show you how much money and how many conversions each network has contributed to.
Social Conversions may be the most crucial metric for your finance department, as they help to justify the amount of time that you invest in social marketing. Google Analytics will show you how much money and how many conversions each network has contributed to. Often you’ll see that audiences from different networks will interact with your website differently. Facebook may be sending more traffic to your website and those who are purchasing may be making smaller purchasers than those who are visiting from Instagram.
Facebook Advertising Metrics for Ecommerce
If you are investing your marketing dollars into Facebook and Instagram ads – and in 2017 this is practically a necessity- you’ll want to keep an eye on several of the reporting metrics that are offered in Facebook Ads Manager.
Amount Spent will help you make sure that you are staying within your allotted budget. When you have multiple campaigns running, you’ll want to see how well each campaign is performing and if budgets should be adjusted. Sometimes the campaign that you think will be your bread winner ends up performing poorly. In those instances, you can choose to stop running the campaign or to lower the budget and move your campaign dollars to more successful campaigns.
To truly see how many people are visiting your website from your Facebook ads, we suggest setting up ROI tracking in the backend of your Volusion store.
Button Clicks are more important than the Cost per Result metric when you are running Website Click campaigns. This is the amount of people that clicked on your ‘Call to Action’ button. The number will be lower than the Results number. This number should be compared to your Network Referrals in Google Analytics. 99% of the time the numbers will not match up, but that’s okay! To truly see how many people are visiting your website from your Facebook ads, we suggest setting up ROI tracking in the backend of your Volusion store. To do so, set up a unique click ID found under the ROI tracking tab in your Volusion admin. Doing so will show you how many site visits you’ve received with this click ID as well as how many sales it has contributed to as well as which sales resulted from these ads.
Frequency is important because you don’t want to give your audience ad fatigue. Do you ever see the same ad day after day in your newsfeed and get annoyed that you keep seeing the same ad? That’s how your audience feels when they see your same ad multiple times a day for several days at a time. To prevent this from happening, set a frequency cap on your campaigns. I recommend a frequency cap of 3 impressions per week as a maximum.
Relevance Score will show you how well your current ads are performing. A relevance score of 7 or above means you’re doing great! A score below that means you need to make some changes to your ad(s). It could be that the targeting is incorrect, your audience is seeing the ad too frequently, or the text and photo need to be revised.
Facebook Ads Manager will provide you with an overwhelming amount of data that may be hard to interpret unless you’re a full-time social media advertiser. Focus your efforts on reviewing the above-mentioned metrics and compare the data monthly to see if your efforts are paying off. Have questions about Facebook or Instagram advertising? Leave them below in the comments and our social media team will respond!


